A single dashboard, from portfolio to individual assets
Portfolio-wide nature performance, asset-level risk indicators, and compliance status - in one place.

See your entire portfolio at once
The portfolio dashboard shows biodiversity scores, habitat quality, and risk exposure across all assets. Filter by region, asset type, or risk level.
Identify which properties need attention. Track year-over-year trends. Benchmark assets against portfolio average.
This is the view CRE teams use to prepare investor presentations and identify properties for deeper assessment.
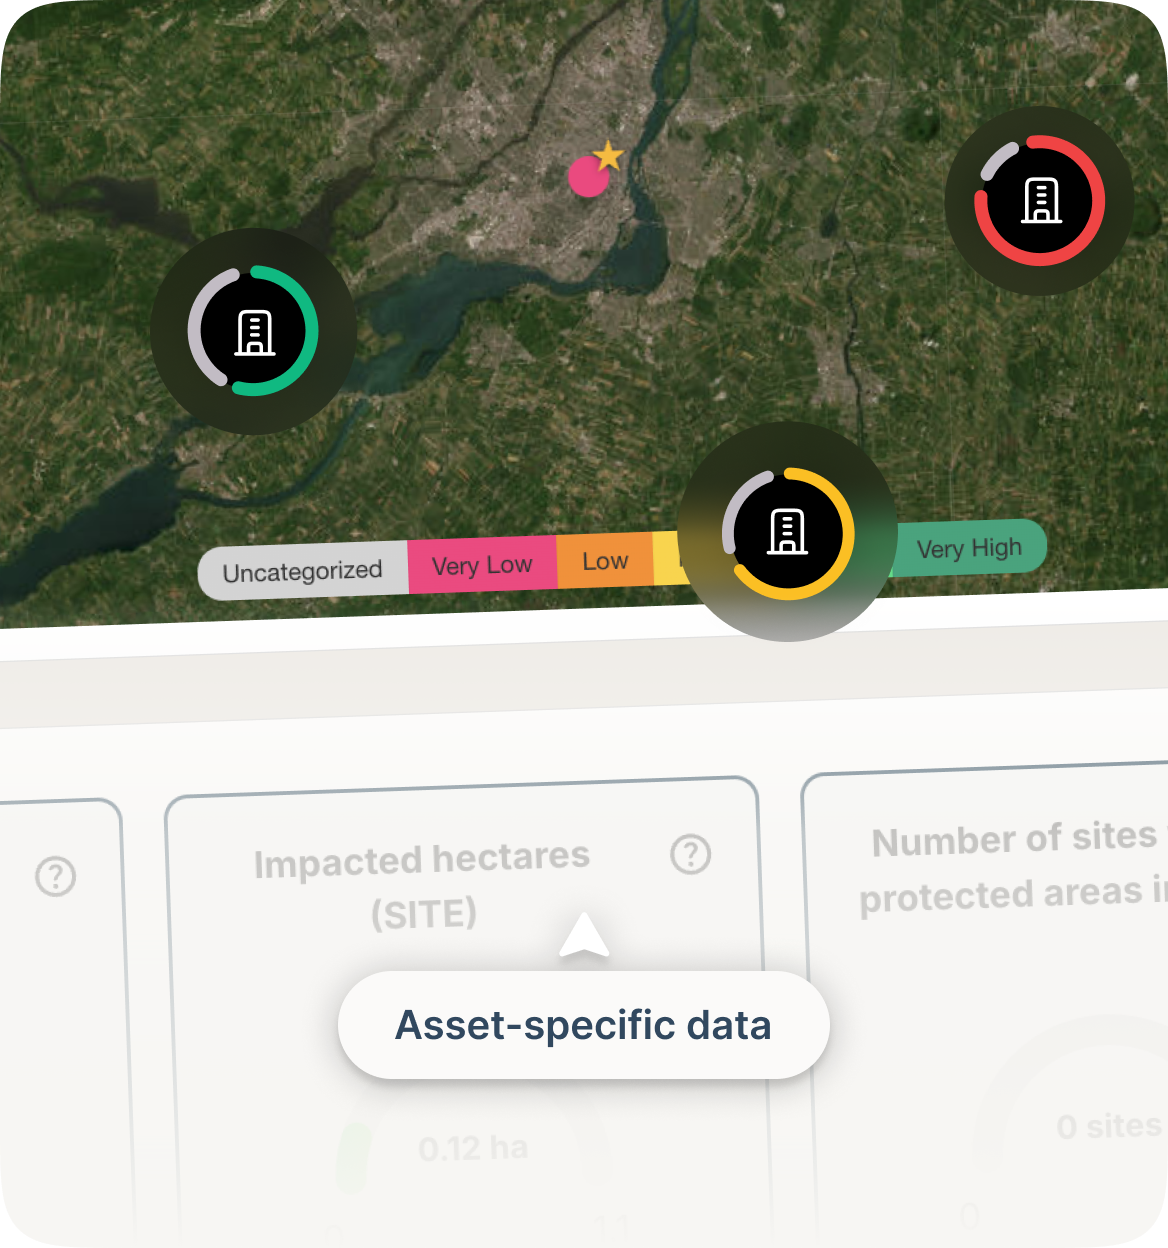
Drill into any site
Asset-level dashboards provide the detail you need for individual property disclosures and due diligence reviews. Click any asset to see:
Site-level biodiversity metrics
Species presence and habitat quality
Dependency and impact assessments
Historical trends and seasonal patterns
Compliance status for TNFD, GRESB, CSRD
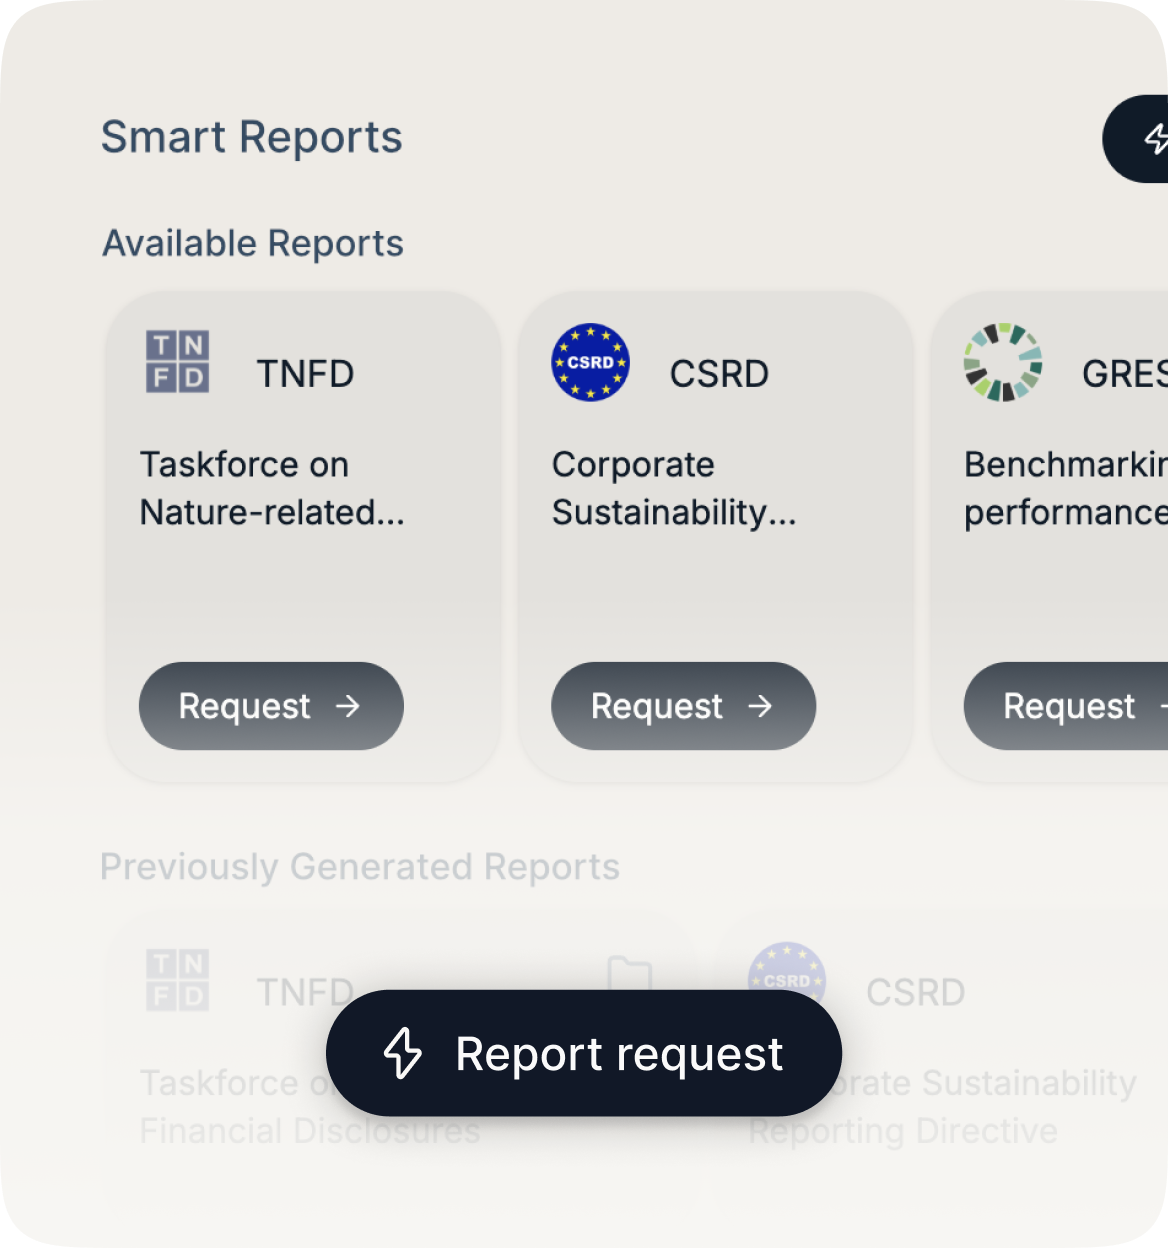
Track what your frameworks require
Aura calculates and displays the specific indicators your reporting frameworks require:
TNFD - Dependency and impact metrics, pressure indicators, response measures
GRESB - Biodiversity scores, habitat protection, species presence
CSRD - Material impact assessments, nature-related risks
Internal targets - Custom KPIs aligned to your ESG strategy
Turn nature data into decisions and reports - without extra work
Automated risk scoring
Properties receive risk scores based on biodiversity sensitivity, habitat proximity, and regulatory exposure. Prioritize sites for deeper assessment or mitigation action.
Downloadable reports
Export portfolio summaries or asset-level reports as PDFs. Include charts, data tables, and methodology documentation for audit trails.
Export to PDF and Excel
Download raw data as spreadsheets for custom analysis or integration with your existing reporting tools.
"Instead of pulling data from multiple sources, we now have one dashboard that shows portfolio- and asset-level insights in real time. It’s simplified reporting and made it much easier to act on the data."