Remote sensing + Onsite monitoring
Aura combines satellite data with ground-truth biodiversity collection to monitor nature indicators across your CRE portfolio.
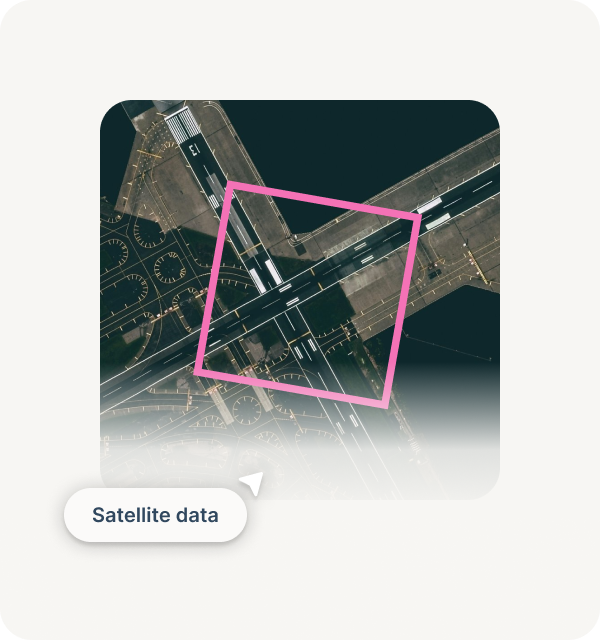
Start with satellite data
Aura analyzes satellite imagery and land cover datasets to establish baseline nature metrics for every property. This provides:
Habitat type and quality indicators
Land use patterns and ecosystem proximity
Water availability and vegetation cover
Year-over-year change detection

Validate with onsite monitoring
Satellite data establishes baselines. Onsite sensors validate and enhance them.
Bioacoustics
Audio recorders capture bird, amphibian, and insect activity.
AI identifies species presence and diversity from sound patterns.
eDNA sampling
Soil and water samples detect species DNA. This reveals biodiversity that visual surveys miss -microorganisms, nocturnal species, seasonal visitors.
Clear, comparable nature data - without manual tracking
Consistent Portfolio-Wide Data
Every property measured using the same methodology. Satellite baselines for all assets, onsite monitoring where regulatory or investor requirements demand it.

Integrated dashboard view
Remote and onsite data appear together in your portfolio dashboard. No separate tools or data sources to reconcile.
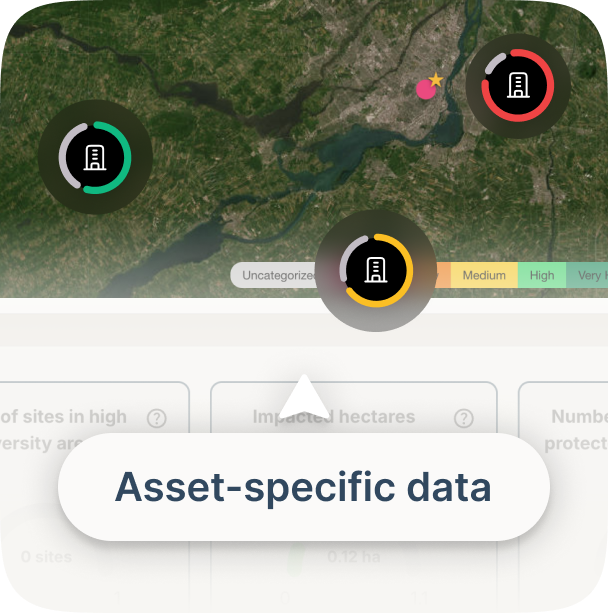
Species-level detection
Ground-truth monitoring identifies which species actually use your sites. This supports TNFD dependency assessments and biodiversity impact calculations.

Ongoing monitoring -
no manual intervention
Portfolio scan
Aura analyzes satellite data for all properties. You receive baseline nature indicators within 2-3 weeks.
Onside deployment
For properties requiring ground-truth validation, Aura installs sensors during a single site visit. Bioacoustic recorders and eDNA sampling equipment require no ongoing maintenance.
Continuous monitoring
Sensors collect data automatically. AI analyzes recordings and samples to identify species and assess habitat quality.
Quarterly reporting
Nature indicators update every quarter. Data flows directly into your portfolio dashboard and disclosure templates.
"Onsite monitoring revealed biodiversity we would have missed relying on remote sensing alone."

See what Aura's automated reporting looks like for your portfolio - before your next deadline.